Workthrough exercises 1 through 2 on page 331 in the book
To see a video demonstration showing you how to complete task#1, watch: https://youtu.be/x8eJXn45q58
1. To create the ER diagram, launch Microsoft Word, go into the
Layout ribbon and change the orientation to landscape
2. Use
the Insert ribbon, Shapes command. Under Flow Chart, select
Internal Storage. Drag an internal storage box on the document
(use the Format ribbon and change the style to one without a fill
color).
3. Select the internal storage box border and press
CTL + C or use the copy button on the Home ribbon
4. Press CTL
+ V to paste or use the paste button on the Home ribbon.
Repeat this process until you have 6 internal storage boxes. As
you are pasting the boxes, drag the borders to reposition them.
5.
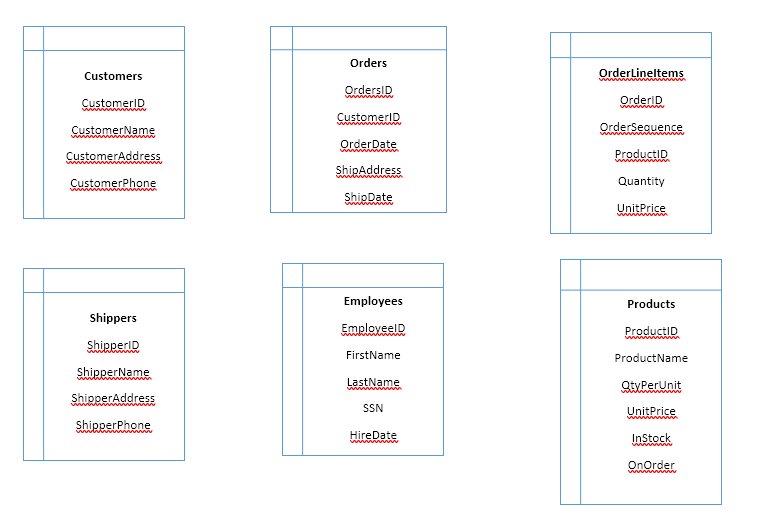
Click on each box and type the data showin in the tables on page 330
(steps 1 and 2)
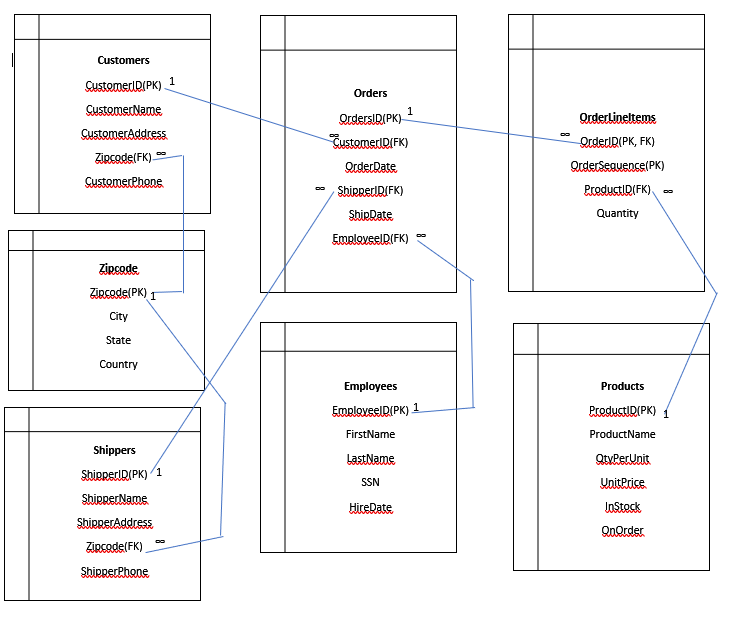
Your document should look similar to the example below:
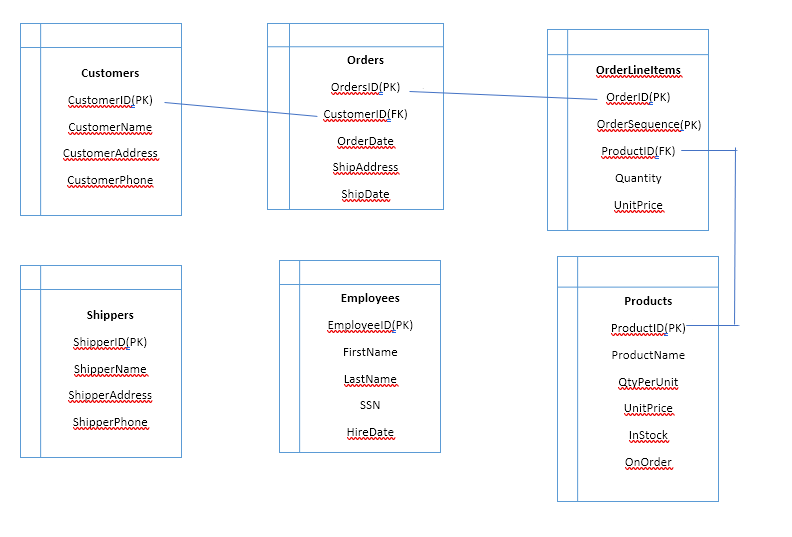
6. Identify Keys and Foreign Keys in the tables by typing (PK) after the key and (FK) after the foreign key
7. Create join lines between the tables by connecting the columns the tables will be joined on with the line shape in Word
At this point, Shippers and Employees cannot be connected to the other tables without modification).
Example:
To connect Shippers to Orders, we will use ShipperID instead of ShipAddress(the address can change, but the shipperID won't because it is a primary key, so it is a better column to add to another table).
To connect Employees to orders, we will add EmployeeID to the Order table as a foreign key. That will allow us to determine which employee placed the order.
Before we proceed any further, we are going to check the tables to make sure the are normalized. Checking for normalization involves looking for 1NF, 2NF and 3NF.
1NF requires no repeating rows or repeating groups wtihin a row. All the tables conform to 1NF.
2NF requires that all columns depend upon all primary keys - this affects composite keys. If you only have 1 column as a primary key, it is in 2NF. The OrderLineItems table has 2 columns as the primary key. Looking through that column, the ProductID is dependent on the OrderID and sequence#, so is the Quantity. Unit price is a problem, but it is OK for 2NF
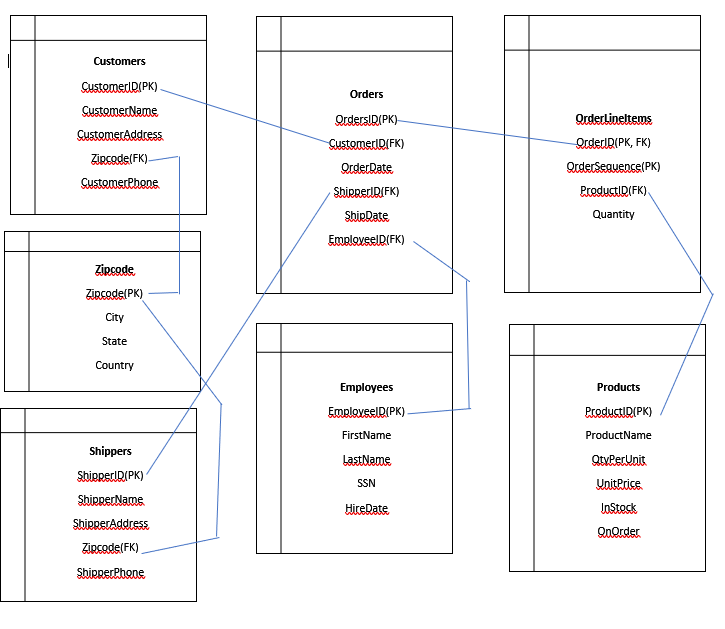
3NF requires that columns are only dependent on the primary key (no other columns). There is an issue with UnitPrice. UnitPrice depends on the product, if the productid changes, the unit price also changes, so we cannot have that in the OrderLineItems table because it violates 3NF. We need to remove UnitPrice and put it into the product table. It turns out that it is already in the product table, so we just need to remove it from OrderLineItems. There is also an issue with CustomerAddress and ShipperAddress. They include zipcode, city, state and country. City, state and country are dependent on zipcode rather than the primary key of each table. If the zipcode changes, the city, state and country may also change. These columns need to be removed and placed into their own zipcode table. The zipcode# can be placed into Customers and Shippers to connect the tables.
After modifying the tables, finish adding the connecting lines between primary keys and foreign keys within the tables
Revised Example:
8. Once we've added all the lines, We need to enter the number 1 next to the primary keys in the relationships. To add the number 1, use the Insert ribbon, textbox command and select simple textbox. Change the textbox style, to remove the fill color and outline color of the textbox. Type a 1 and resize the box. Use the move handle below the box to reposition the 1 so it is next to the beginning of the join line in the customers table near the primary key field. Click the textbox and use the copy command. Use the paste command and move the textbox next to the line by the primary key in orders. Do the same thing for Products.
Example:
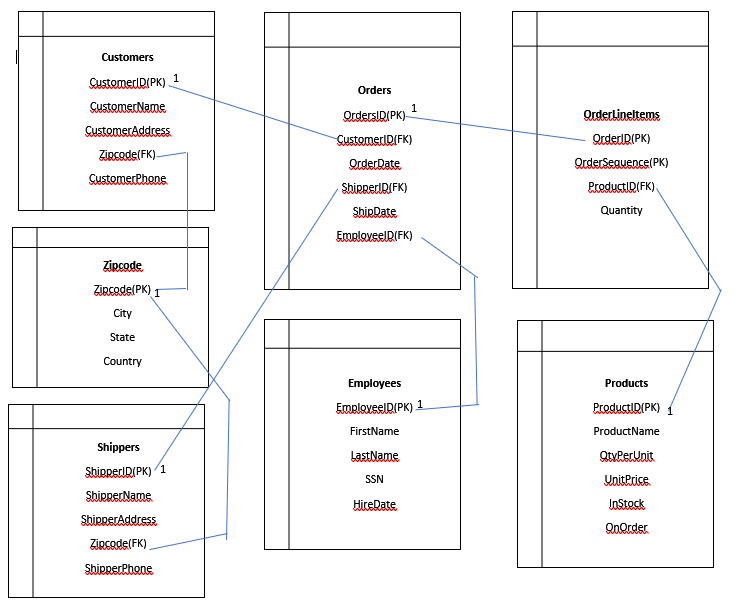
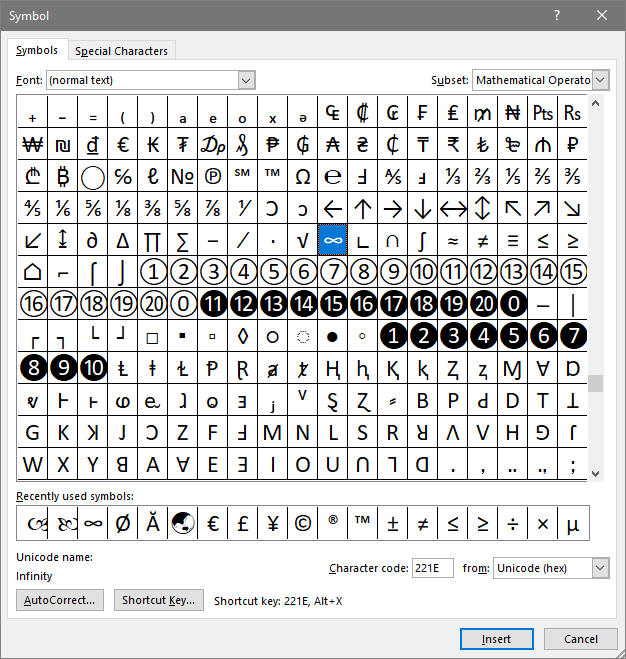
9. All relationships between tables are 1-to-many relationships. To signify many, you can use the infinity symbol. Copy and Paste the 1 box and move it next to Customer ID in the Orders table (it should be at the end of the connecting line). Then, delete the number 1 from that box and insert the infinity symbol.
To get to the infinity symbol, use the Insert ribbon and click the list arrow by Symbol which is on the right-hand side of the ribbon. You should see infinity in the list of symbols, if you don't click the More Symbols command to display a Symbol Dialog box. Change the font to Normal Text, scroll down about 3/4 to the bottom to find the symbol (see example below). To insert the symbol, select it and then click the Insert button. Click Close to return to the document
10. Click on the textbox with the infinity symbol and copy it, then paste and position it next to OrderID in the OrderLineItems table. Paste it again and position it next to ProductID in the OrderLineItems table Continue pasting until all the foreign keys have the infinity symbol next to them. Your completed document should look like the example below:
11. Save the document as ER-diagram-page331.docx
12. Upload the document to the dropbox.
To see a video demonstration showing you how to complete the task#2 spreadsheet, watch: https://youtu.be/G7eDf8kJUIg
To see a video demonstration showing you how to complete the task#2 ER diagram, watch: https://youtu.be/xMS117lY0PI
A lot of data is stored in Excel files that is better suited for a database which is why we are starting in Excel. Excel also helps you visualize how the tables will be laid out with data in them rather than just columns.
1. Download the following Excel spreadsheet: Normalization Exercise in-class.xlsx
2. Open the worksheet and review the data.
3. What different groups are represented by the data?
We can start with 4 tables and see if we need more.
Department: DepartmentNumber(PK), DepartmentName
Performance:
employeeID(PK), review date (PK), last review, assessment, approval,
comments, reviewer
Employee: employeeID(PK), First Name, Middle
Initial, Last Name, Department Number, Title
Manager: ID(PK),
employeeID(PK)
Are the tables in 1NF?
Determining factors:
a. Each field (i.e. column) value must be a
single value only.
b. All values for a given field (column ) must be
of the same type.
c. Each field name (column label) must be unique.
d. No two records (rows) in a relation can be identical
(having a primary key ensures unique rows)
Yes, they are in 1NF
Are the tables in 2NF?
Determining factors: all non-key fields must be dependent upon the key (tables with single key fields re in 2NF, composite keys need to be checked more closely)
Department- Yes,
Performance - No, last review is dependent on
employee ID, but not review date. If we remove that, Performance
is will be in 2NF
Employee – Yes
Manager Yes
Revised tables:
Department: DepartmentNumber(PK), DepartmentName
Performance: employeeID(PK), review date (PK), assessment, approval, comments, reviewer
Employee: employeeID(PK), First Name, Middle Initial, Last Name, Department Number, Title
Manager: ID(Pk), employeeID(PK)
Are the tables in 3NF?
Determining factors: A table is in third normal form if it is in 2NF AND every non-key column depends only on the primary key. To make this happen, you must remove transitive dependencies (Boyce-Codd normal form).
Department – Yes
Performance
– Yes
Employee – No, title can be dependent on department (partial
dependency)
Manager – Yes
Revised employee table: The employee
table will be split into a position table and an employee table.
Employee: employeeID(PK), First Name, Middle Initial, Last Name, Department Number, JobCode
Positions: JobCode(PK), Job Description, Job Title
Department: DepartmentNumber(PK), DepartmentName
Performance: employeeID(PK), review date (PK), assessment, approval, comments, reviewer
Manager: ID(Pk), employeeID(PK)
Are the
tables in 4NF?
Determining factors: Only 1 column within the table can have multiple values
Employee – Yes (no multi-value columns)
Positions –
Yes
Department – Yes
Performance – Yes
Manager – Yes
(employeeID would be multivalued, but since it is part of the key, the
combination of ID and employeeID is unique)
At this point, we are going to look at relationships and how we can
connect the tables. We already have primary keys defined, so we
need to determine what the foreign keys are
Employee: employeeID(PK), First Name, Middle
Initial, Last Name, Department Number(FK), JobCode(FK)
Positions:
JobCode(PK), Job Description, Job Title
Department:
DepartmentNumber(PK), DepartmentName
Performance: employeeID(PK),
review date (PK), assessment, approval, comments, reviewer(FK)
Manager: ID(Pk), employeeID(PK, FK)
4. Configure Excel to illustrate how the tables will look - to
see an example, view:
Normalization Exercise.htm
5. Create an ER Diagram in Word for the 5 tables - download the following document: normalization exercise.docx Enter the join lines and 1 to many symbols (infinity symbol). You can assume the reviewer in the performance table is the manager AND that ID and reviewer are the same thing (the manager's ID)
6. Upload the Excel and Word files to the dropbox.
If you would like to see another example of a spreadsheet that has been normalized, view: normalization-example.html